We Blind-Tested Our TTS Against Every Major Competitor. Here Are the Results.
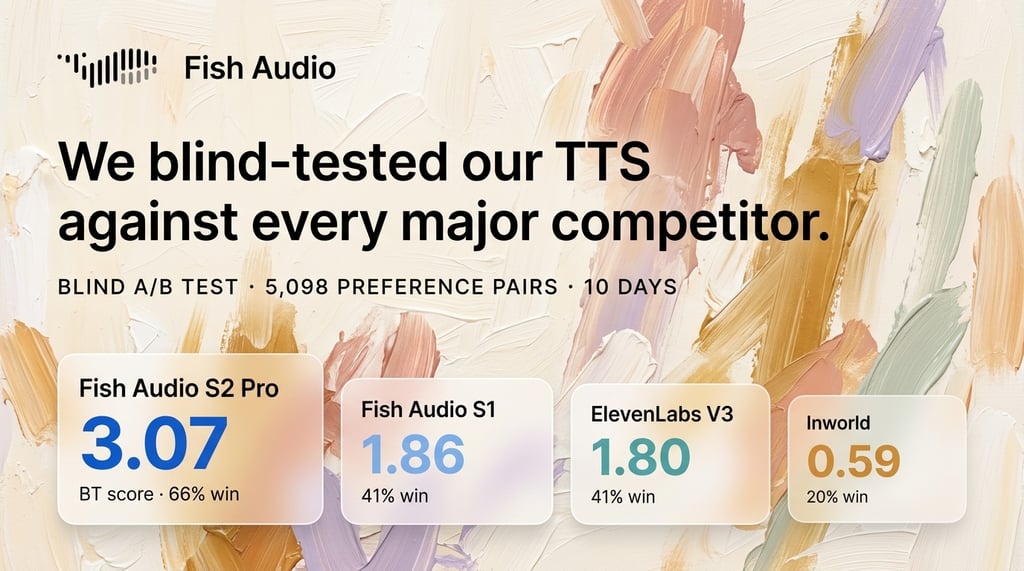
Fish Audio ran a 10-day blind A/B test on real production traffic, pitting Fish Audio S2 Pro and S1 against ElevenLabs, Inworld, and MiniMax. Over 5,000 preference pairs were collected from real users who had no idea which provider generated which audio.
TLDR: Results
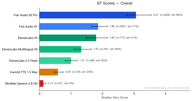
Fish Audio S2 Pro ranked #1 overall with a Bradley-Terry score of 3.07, nearly 1.7x the next best model. Our older model, Fish Audio S1 (BT 1.86), also outperformed every third-party provider in aggregate.
| Rank | Model | BT Score | Win Rate | Samples |
|---|---|---|---|---|
| 1 | Fish Audio S2 Pro | 3.07 | 65.7% | 4,573 |
| 2 | Fish Audio S1 | 1.86 | 41.0% | 3,560 |
| 3 | ElevenLabs V3 | 1.80 | 40.6% | 766 |
| 4 | ElevenLabs Multilingual V2 | 1.35 | 36.2% | 359 |
| 5 | ElevenLabs 2.5 Flash | 1.00 | 29.8% | 364 |
| 6 | Inworld TTS 1.5 Max | 0.59 | 20.1% | 373 |
| 7 | MiniMax Speech 2.8 HD | 0.12 | 5.0% | 201 |
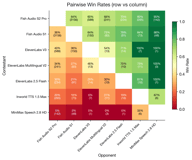
Key head-to-head matchups:
- Fish S2 Pro beats ElevenLabs V3 60% to 40% (581 pairs)
- Fish S2 Pro beats Inworld 80% to 20% (261 pairs)
- Fish S2 Pro beats MiniMax 95% to 5% (142 pairs)
- Fish S1 beats ElevenLabs V3 64% to 36% (150 pairs)
Why We Did This
The Problem with Traditional Metrics
MOS (Mean Opinion Score) remains the de facto standard for TTS evaluation, but it is deeply flawed. Test conditions are rarely disclosed — sample length, listener demographics, playback environment, and rating instructions all vary across studies, making cross-paper comparisons meaningless. Meanwhile, WER/CER (word/character error rate) can be counterproductive as an optimization target: pushing WER too low often forces the model into hyper-articulated, robotic speech that sacrifices naturalness and prosody for intelligibility. A model that occasionally mumbles like a real human may actually sound better than one that enunciates every syllable perfectly.
The Problem with Existing Leaderboards
Public leaderboards like TTS-Arena-V2 and Artificial Analysis evaluate models on short, simple sentences — typically a single line of dialogue or a brief narration. This fails to capture the complexity of real-world TTS usage: long-form content, multi-speaker dialogue, expressive prosody tags, and multilingual text.
Beyond methodology, there are integrity concerns. TTS-Arena-V2 has had known issues with audio header leaking, where metadata in the audio file could reveal the provider identity — breaking the blind evaluation premise. We are also aware that leaderboard gaming is widespread: providers optimize specifically for benchmark sentences, submit cherry-picked model checkpoints, or inflate rankings through coordinated voting. These leaderboards have become marketing tools rather than reliable quality signals.
What We Actually Wanted
We needed a reliable internal reward signal — a ground-truth measure of "which TTS output do real users actually prefer?" that we could trust for model development decisions. Not a number from a paper, not a rank on a gameable leaderboard, but a continuous stream of honest preference data from users making real choices.
So we built a blind evaluation pipeline directly into our production platform.
Experiment Design
Blind Paired Comparison
Fish Audio's studio presents users with two audio versions side by side for every TTS task. Each version independently has a 10% chance of being silently routed to a competing provider instead of the default Fish Audio backend. Same text, same reference voice, same UI — the user has no idea which provider generated which audio.
The experiment ran for 10 days (March 26 - April 5, 2026) and collected 71,000+ paired groups, of which 5,098 contained cross-provider comparisons that met our quality criteria.
What Counts as a "Win"
We use a strict behavioral signal, not a subjective rating:
- The user must play both versions at least 2 times each — confirming they actually compared both
- Exactly one version gets downloaded — that is the winner
This "listen-then-download" signal is far more reliable than star ratings or forced-choice surveys. Users are making real decisions about audio they will actually use.
User Composition
The experiment sampled approximately 70% new users and 30% returning users. This composition may introduce a slight bias toward Fish Audio (returning users are already familiar with our platform), but also ensures we capture genuine first-impression preferences from the majority of participants.
Voice Selection
We used the platform's Top 500 public voices for the experiment. Each voice was cloned to the third-party provider's system beforehand, ensuring the same reference voice identity was available on both sides. Voice ID mappings are maintained in dedicated JSON map files that serve as the single source of truth for routing eligibility.
Providers and Models Tested
| Provider | Model | Route Target |
|---|---|---|
| Fish Audio | S2 Pro (latest) | fish:s2-pro |
| Fish Audio | S1 (previous gen) | fish:s1 |
| ElevenLabs | V3 | elevenlabs:v3 |
| ElevenLabs | 2.5 Flash | elevenlabs:2.5-flash |
| ElevenLabs | Multilingual V2 | elevenlabs:2-multilingual |
| Inworld | TTS 1.5 Max | inworld:inworld-tts-1.5-max |
| MiniMax | Speech 2.8 HD | minimax:speech-2.8-hd |
Evaluation Coverage and Tag Support
Not all providers support the same feature set. Fish Audio S2 Pro supports rich prosody tags (e.g., [laughs], [sighs]) and speaker tags (<|speaker:N|>) for multi-speaker content. This matters because our production traffic naturally includes tagged text.
- ElevenLabs V3 received the most complete evaluation — it supports arbitrary tags after normalization to parenthesized form, so it was eligible for virtually all requests regardless of content
- ElevenLabs 2.5 Flash and Multilingual V2 — we only sent plain-text requests to these models (no tags)
- Inworld — plain-text only, and restricted to
mp3output format, further limiting its eligible traffic - MiniMax — accepted interjection tags (
(laughs),(sighs), etc.) but rejected other tag types. Due to consistently poor user preference results, the experiment was early-stopped to avoid further degrading user experience
The routing system evaluates each alternative provider against the current request's features (language, tags, format, multi-reference voices). Only supported alternatives become eligible candidates, and one is selected via weighted random choice. If the only eligible alternative is a Fish-vs-Fish comparison (S1 vs S2 Pro), the effective sampling probability is reduced to 1/10th of the base rate to prioritize cross-provider data collection.
What This Cost Us
These experiments are not free. Third-party TTS APIs are expensive at scale:
- ElevenLabs: $1,500+ spent on API calls
- MiniMax: $330 spent (early-stopped due to poor performance)
- Inworld: $170 spent
Statistical Methodology
Bradley-Terry Model
Raw win rates can be misleading when different models face different opponents at different frequencies. The Bradley-Terry model solves this by computing a global strength score from pairwise comparison data. It iteratively estimates each model's latent "strength" parameter such that the predicted win probability between any two models matches the observed data.
For two models $i$ and $j$ with BT scores $p_i$ and $p_j$:
$$P(\text{i beats j}) = \frac{p_i}{p_i + p_j}$$
Our implementation runs up to 500 iterations with convergence tolerance of $10^{-9}$, normalizing scores using the geometric mean at each step.
Confidence Intervals
We report 95% bootstrap confidence intervals computed from 200 resamples of the preference pair data. Each resample draws $n$ pairs with replacement from the original $n$ pairs and re-runs the full BT computation. The 2.5th and 97.5th percentiles of the bootstrapped scores form the CI bounds.
For per-backend win rates, we use Wilson score intervals which provide better coverage than normal approximation intervals at extreme win rates.
Per-Language Results
Latin Script Languages (English, Spanish, French, German, ...)
Latin-script languages represent the largest segment with 4,173 preference pairs.
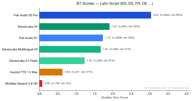
Fish S2 Pro leads at 3.05. Notably, ElevenLabs V3 (1.90) slightly outperforms Fish S1 (1.72) in this category — the only language group where any competitor edges past our older model. ElevenLabs Multilingual V2 also performs well at 1.70, close behind S1.
This makes sense: ElevenLabs has historically focused on English and European languages, and their V3 model is strong in this domain. Still, Fish S2 Pro maintains a 1.6x advantage over ElevenLabs V3.
Chinese
Chinese has 329 preference pairs and shows the most dramatic Fish Audio dominance.
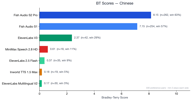
Both Fish Audio models (S2 Pro at 8.11, S1 at 7.11) massively outperform all competitors. ElevenLabs V3 scores 2.36 — respectable but far behind. All other competitors score below 1.0.
Japanese
Japanese has 354 preference pairs.
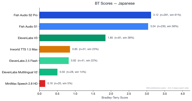
Fish S2 Pro (3.12) and Fish S1 (3.02) are very close, both far ahead of ElevenLabs V3 (1.88). The gap between Fish models and competitors is largest in CJK languages.
Cross-Language Summary
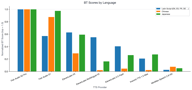
Fish Audio S2 Pro ranks #1 in every language category. The competitive gap varies:
- Latin script: Competitors are closest, ElevenLabs V3 is genuinely competitive (relative score 0.62)
- Chinese: Fish Audio dominance is overwhelming, competitors barely register
- Japanese: Similar to Chinese — Fish models are far ahead
Limitations
API Users Excluded
To ensure platform stability, API users were not included in the experiment. The 10% sampling rate applies only to web platform users. This means our results reflect web-platform usage patterns, which may differ from API-heavy production workloads.
Tag Support Creates Uneven Coverage
Because third-party providers have varying tag support, they received different subsets of traffic:
- ElevenLabs V3 was eligible for nearly all requests (supports tags)
- ElevenLabs Flash/Multilingual only received tag-free requests
- Inworld only received tag-free, mp3-format requests
This means the competitive field is not perfectly level. ElevenLabs V3's results are the most directly comparable to Fish Audio since it received the most representative traffic sample. Other models were evaluated on a subset that skews toward simpler, plain-text requests — which arguably should favor them.
MiniMax Results May Be Unreliable
MiniMax Speech 2.8 HD scored extraordinarily low (BT 0.12, 5% win rate — even against Inworld). We suspect our MiniMax API integration may not be optimal. After listening to several MiniMax-generated samples, we could not identify a specific technical issue — the audio was intelligible but exhibited noticeably worse prosody and naturalness compared to all other providers. We widened MiniMax routing eligibility mid-experiment to increase sample size, but performance did not improve. The experiment was early-stopped after accumulating $330 in API costs with no sign of competitive results.
If MiniMax believes these results do not reflect their model's true capability, we welcome a collaborative review of our integration.
Voice Mapping Constraints
Only voices with successful clones on the third-party platform can be routed. If a voice clone failed, that voice was excluded from that provider's eligible pool. This means each provider was tested on a slightly different (though largely overlapping) subset of the Top 500 voices.
Possible Platform Familiarity Bias
While we sampled ~70% new users, the remaining ~30% returning users may have developed preferences aligned with Fish Audio's audio characteristics. We believe this effect is small given the majority-new-user composition, but it cannot be fully ruled out.
Conclusion
We believe this is one of the most rigorous public evaluations of TTS quality ever conducted:
- Real users, not paid annotators
- Blind comparison — users never know which provider generated which audio
- Behavioral signal (download) rather than subjective ratings
- Production traffic with real-world text complexity, including long-form content, prosody tags, and multilingual text
- 5,000+ preference pairs across multiple languages, collected over 10 days
- $2,000+ spent on third-party API calls alone
The results are clear: Fish Audio S2 Pro is the preferred TTS model across all languages tested, with particularly strong advantages in Chinese and Japanese. Even our previous-generation S1 model outperforms every competitor in aggregate.
These results further validate our roadmap for end-to-end modeling and RLHF (Reinforcement Learning from Human Feedback). We're committed to transparency. The methodology, routing logic, and analysis code are part of our platform infrastructure. We invite the TTS community to scrutinize our approach and suggest improvements for future evaluations.
This evaluation was conducted by the Fish Audio team from March 26 to April 5, 2026. For questions or to discuss the methodology, reach out at fish.audio.